ReverseCNN
Saliency heatmaps for CNNs in radiology.
July 12, 2017
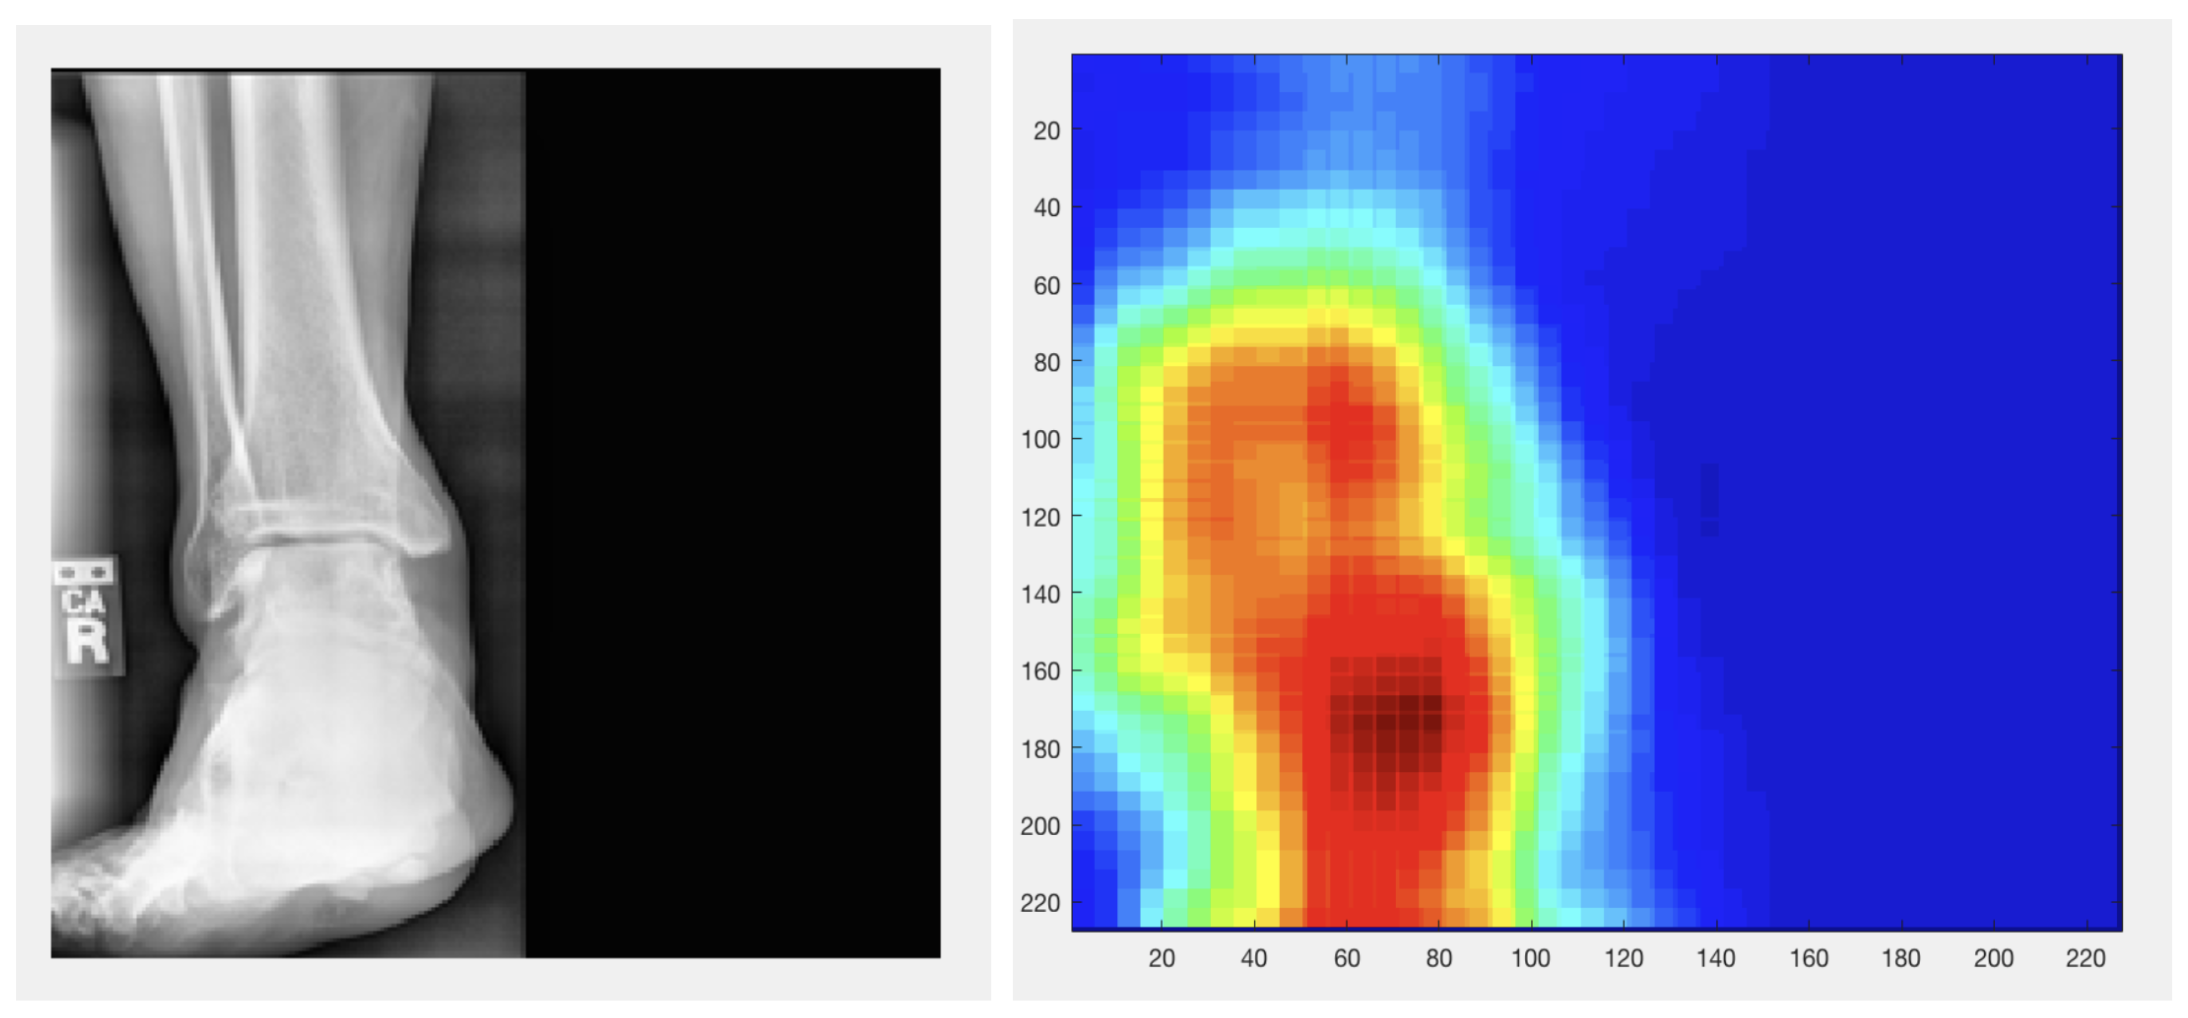
Objective: Given a pre-trained CNN for classifying radiology images, create a heatmap that details which areas of an input image are the most important for classification.
Languages used: MATLAB, Python.
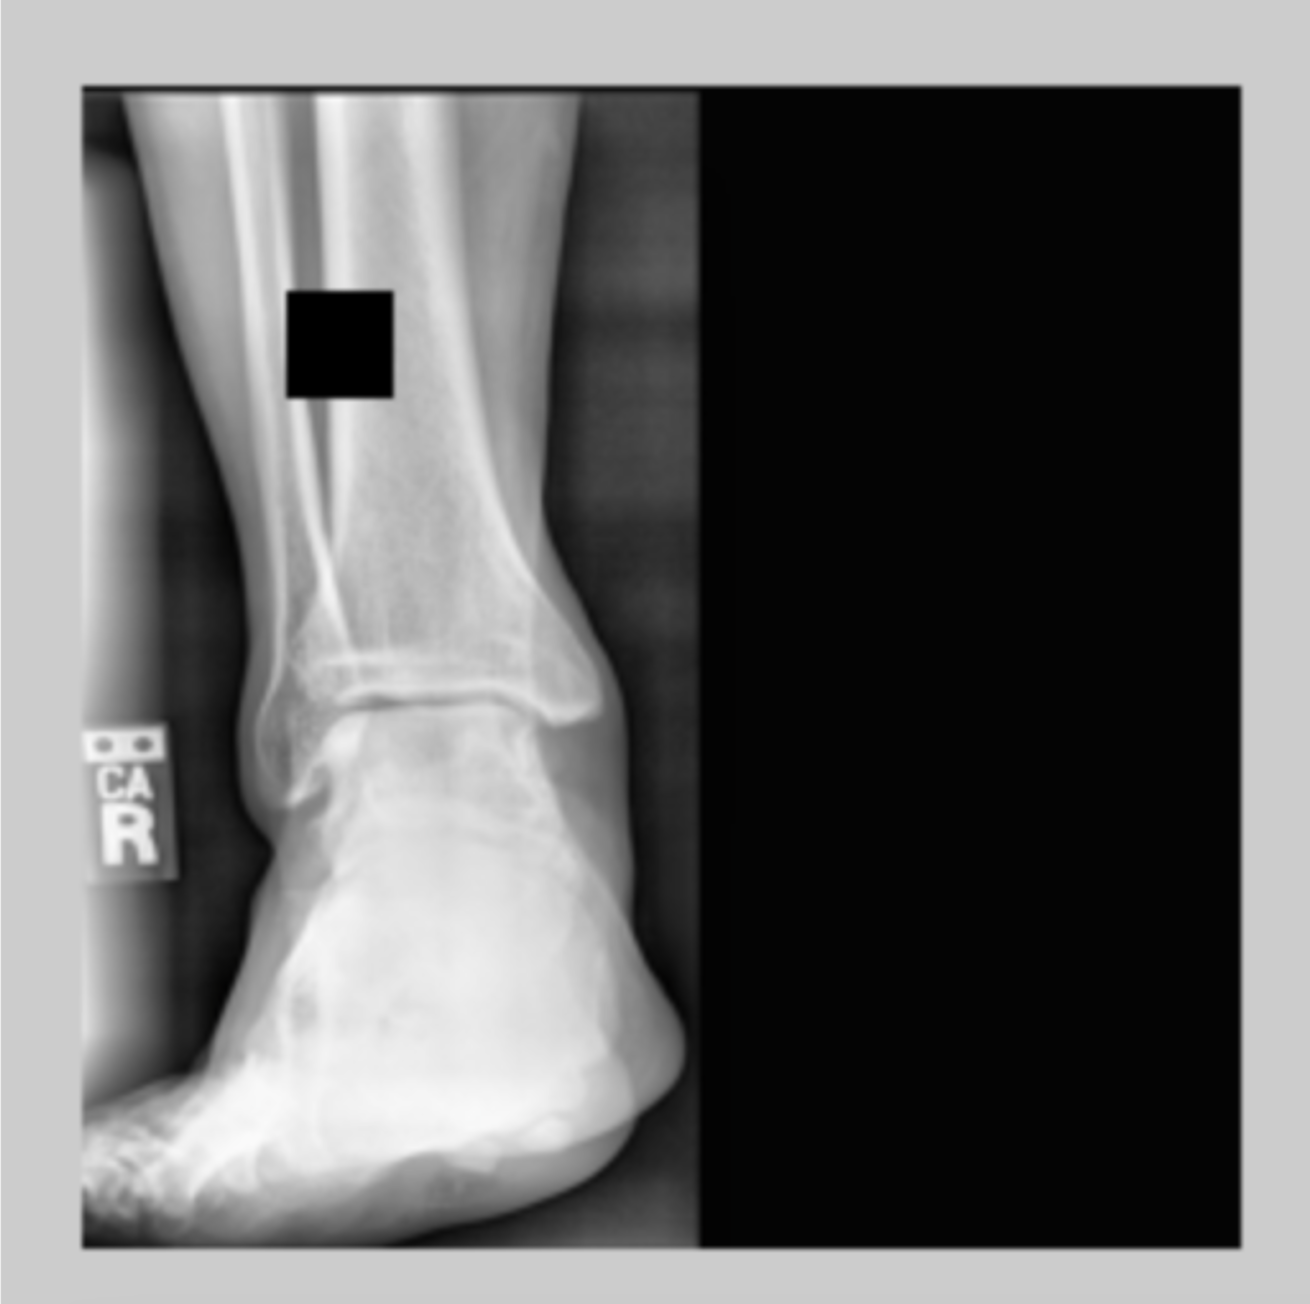
Image produced by occlusion script (version 1): a black square occlusion that covers part of an x-ray scan of an ankle and iterates over entire image.

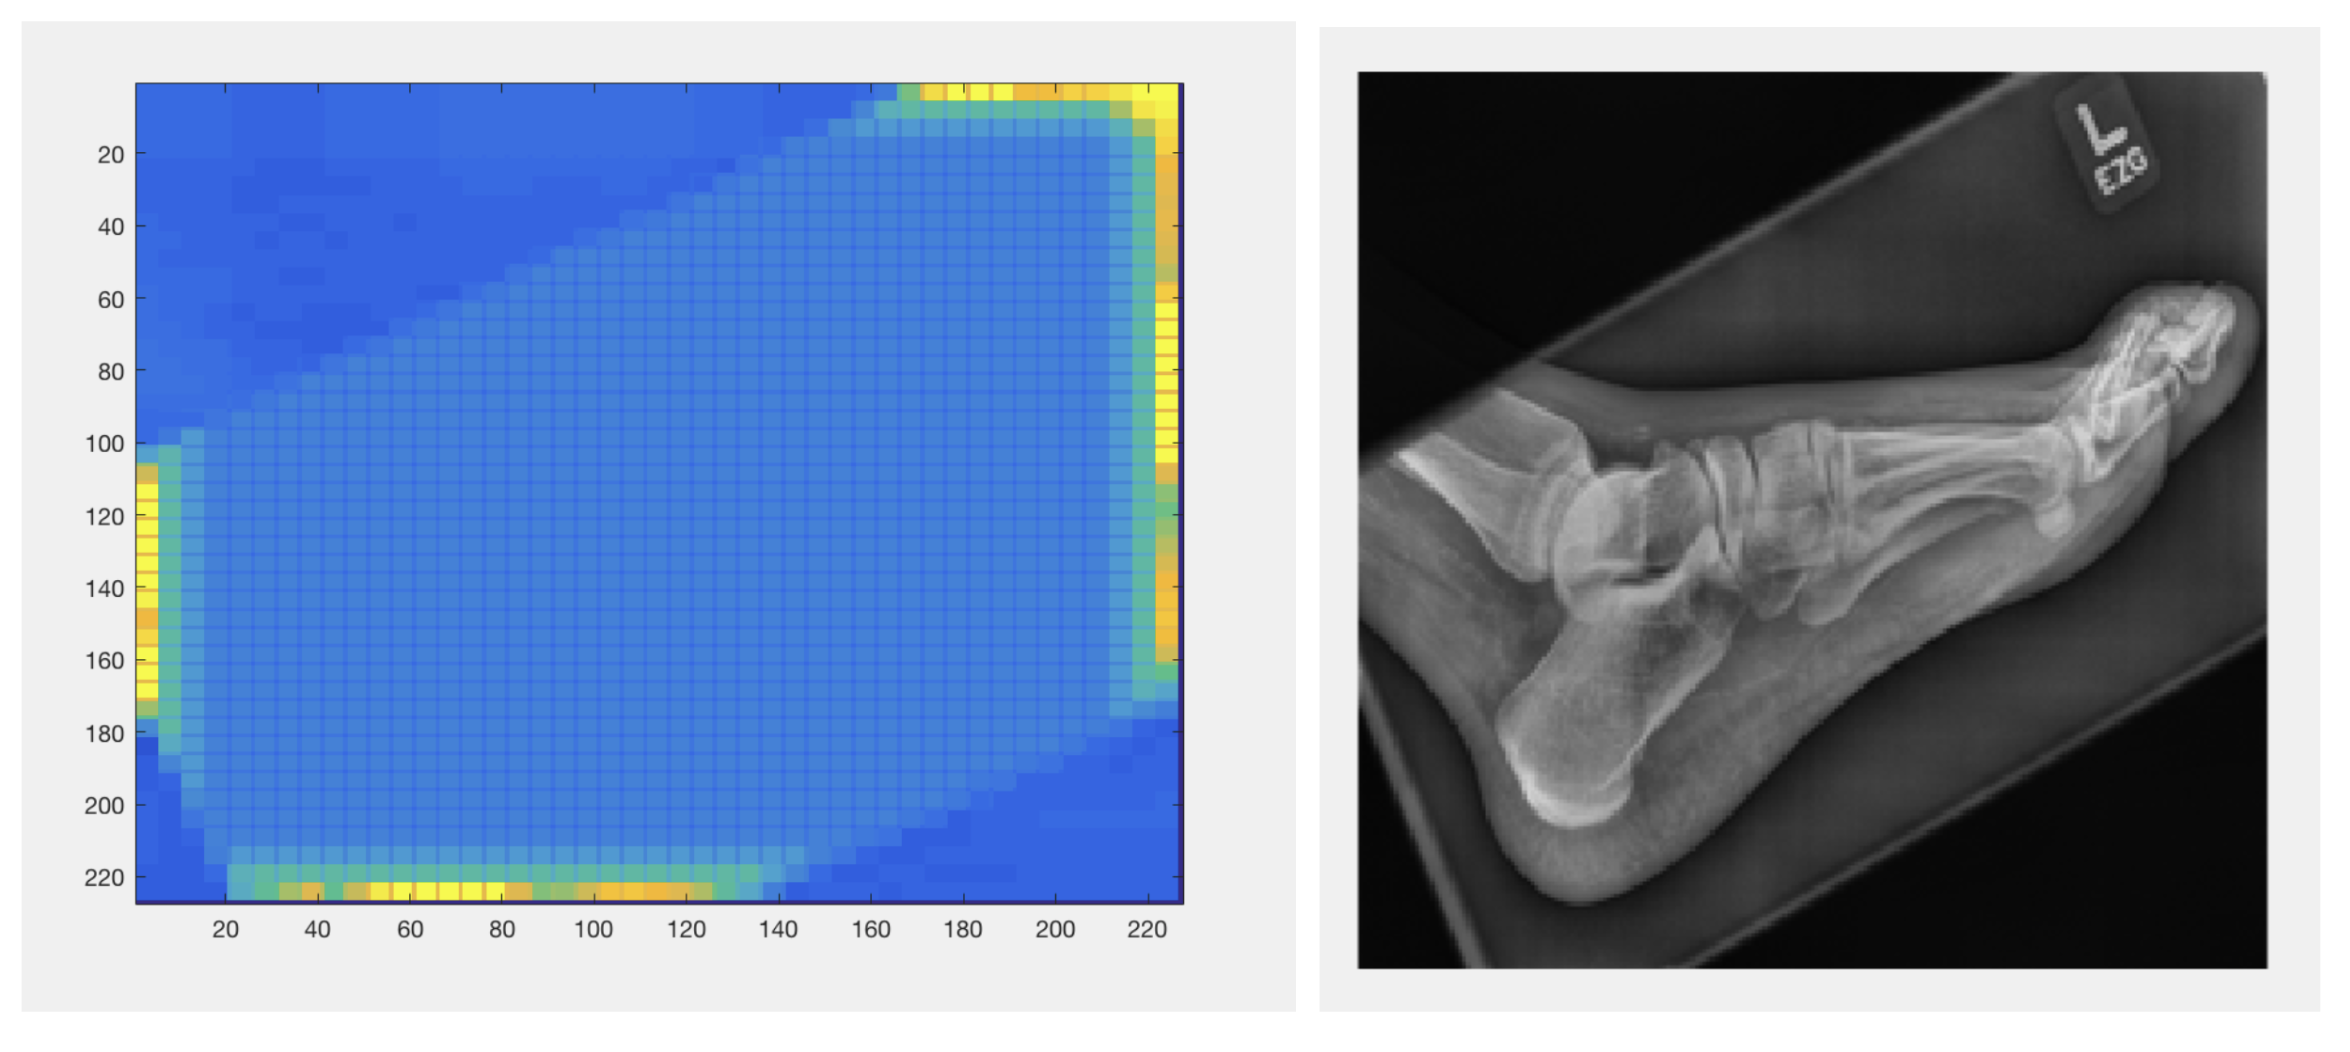
Images produced by overlap script (version 2): basic heatmap that is generated by just the pixel value of an image (left picture); the original x-ray scan image (right picture).

Images produced by final heatmap script (version 3): a complete heatmap that shows how important a part of an image is to the classification result of the specific image. This is generated by combining both version 1 and version 2 and incorporating the pre-trained CNN.

Generating occlusion heatmaps for the top 3 classes:
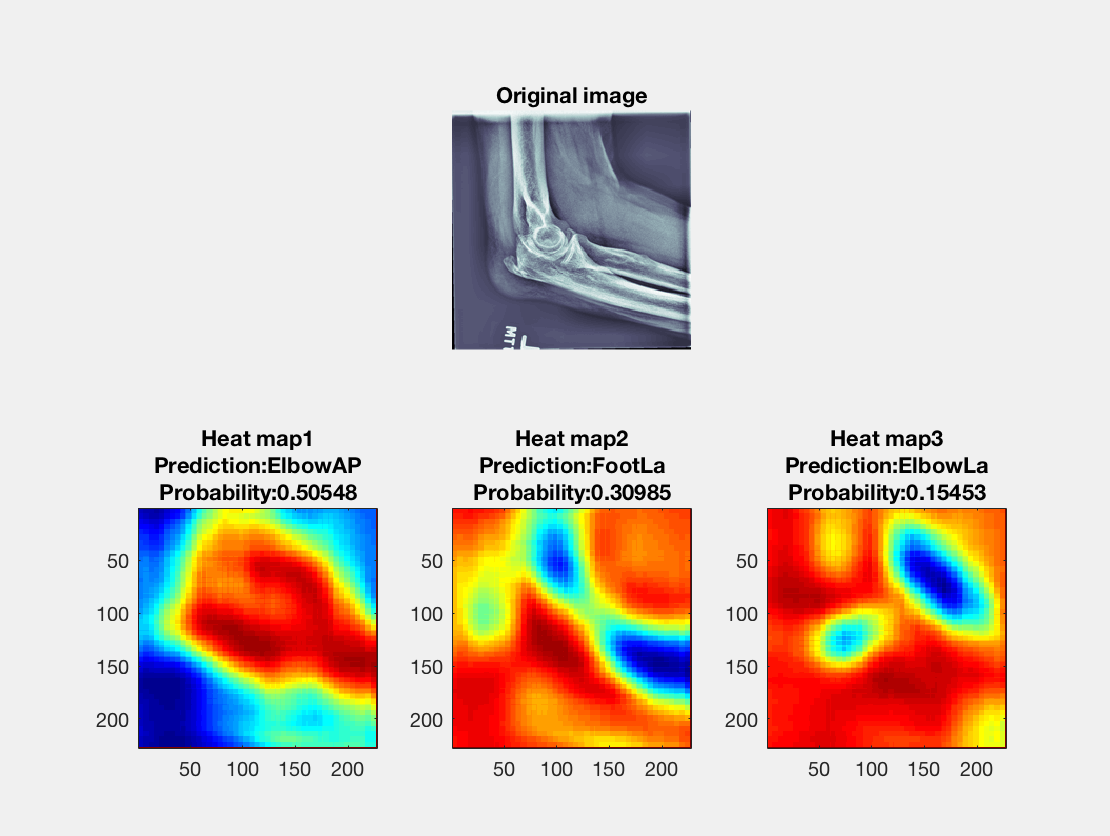
I also wrote code to generate a figure that includes the original image, along with occlusion heatmaps that were generated for the top 3 highest probability classes. As shown below, each heatmap (arranged left to right) was calculated with the same algorithm as described above. Above each image is a label that shows what class the probability was shown for.
