Characters & Connections
Visualizing student community in Eliot House at Harvard.
About This Project
Eliot House, one of the twelve undergraduate residential houses at Harvard, holds a special place for all who know it. From the friendly, familiar faces of Eliot House staff to the students who crowd the bustling dining hall every evening, Eliot is a welcoming home for hundreds of individuals. As an Eliot resident for the past three years, I have formed many meaningful relationships with others in the house, and I will always be grateful for Eliot’s tight-knit community.
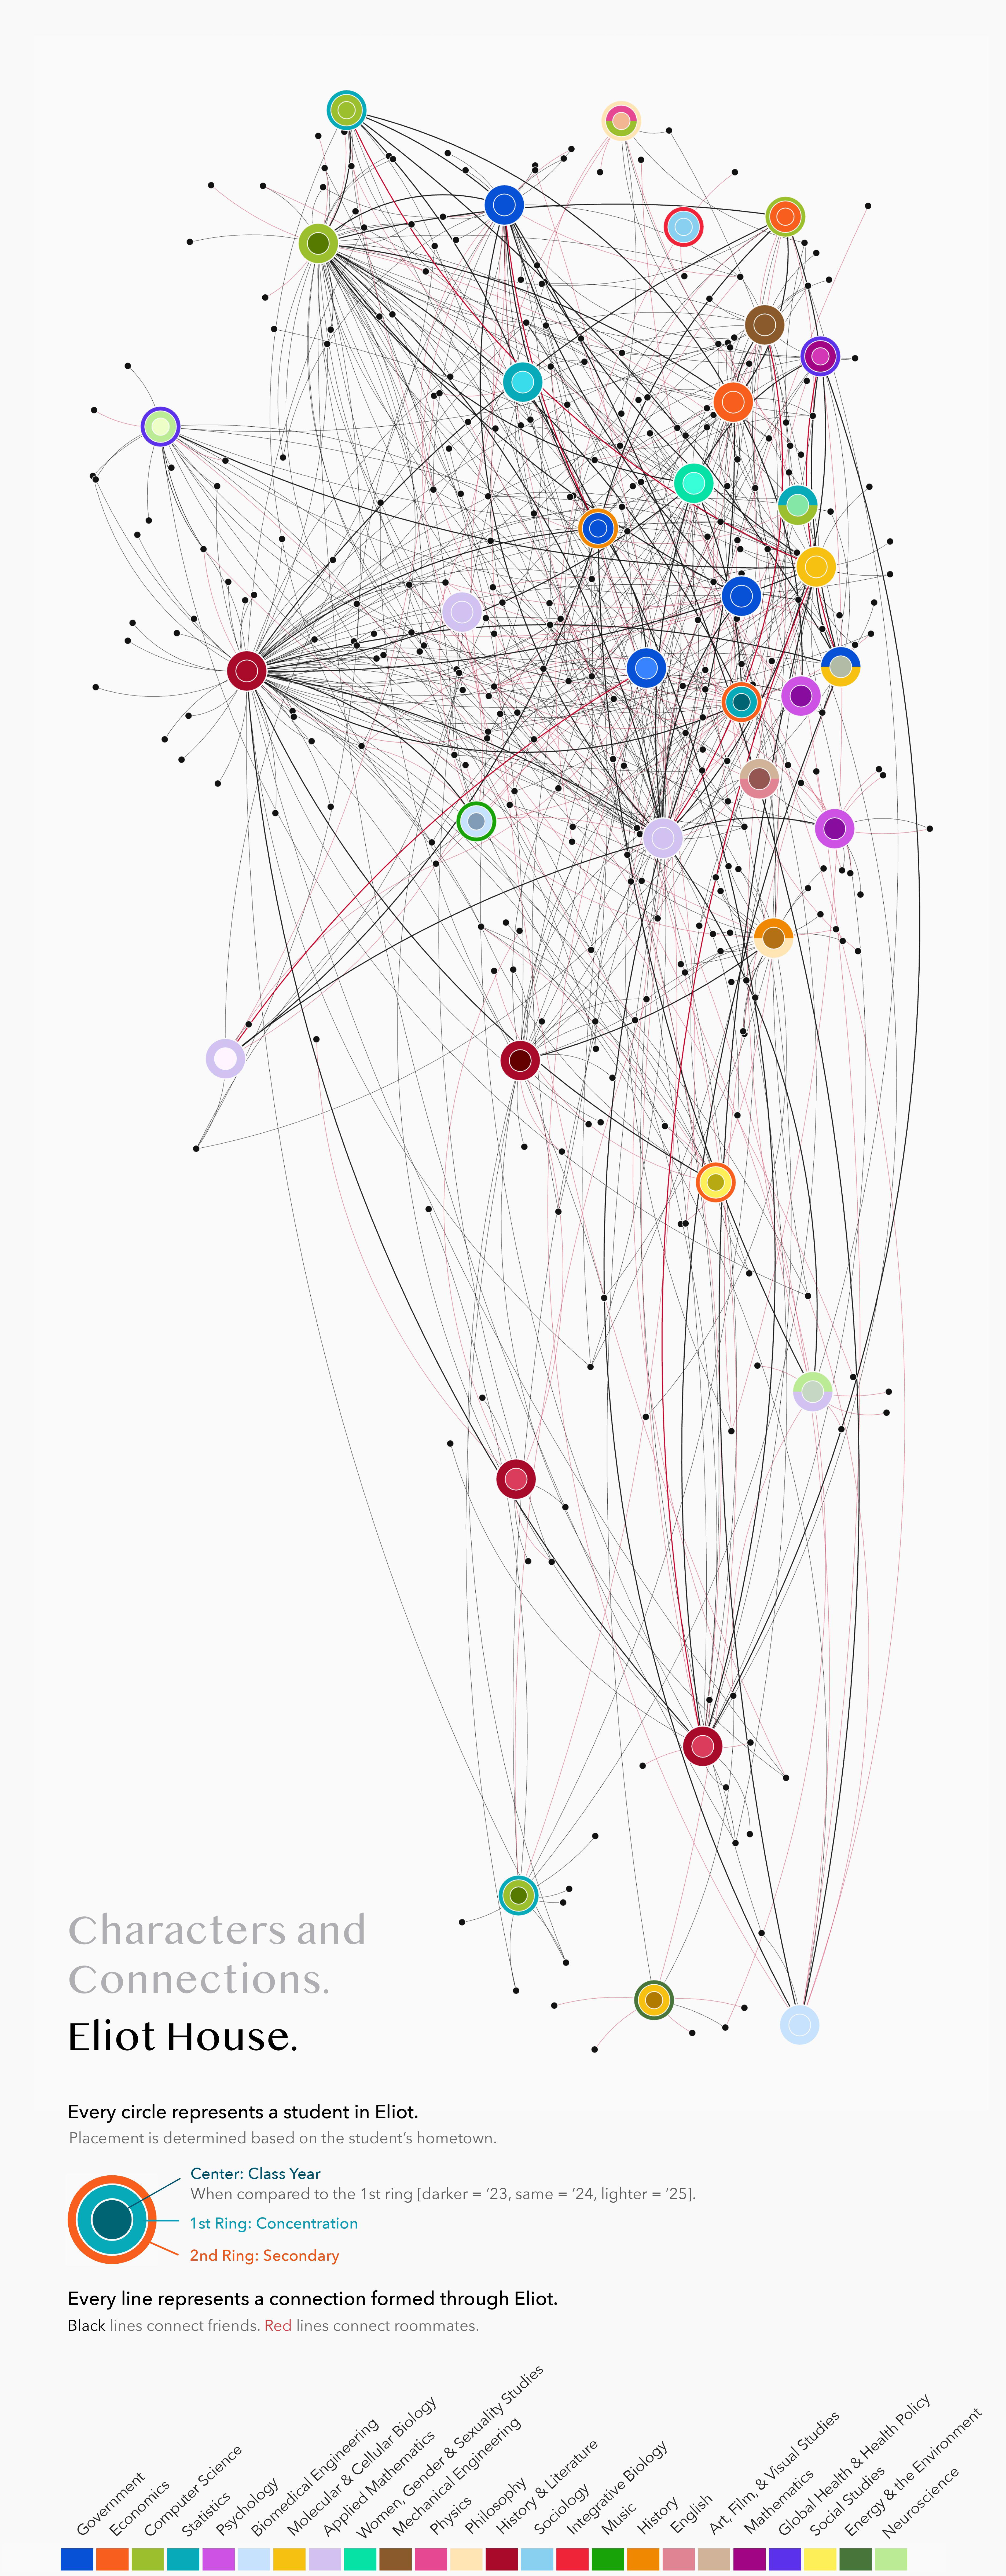
My goal was to create a data visualization portraying the essence of the Eliot House community: the people in the house and the many connections between them. I collected data from students in the house and created a network graph visualization (with 38 nodes and 655 links!), representing students as nodes and connections fostered by Eliot as edge links.
Through the visualization piece, I hope to leave the viewer with a colorful impression of Eliot’s vibrant and diverse community, because at the end of the day, what makes Eliot so special are its characters and connections.
Process
Some of the main questions I considered when making the visualization were:
- How can I capture the diversity of student backgrounds and intellectual interests?
- What is the best way to visualize connections between people?
- How can I encode and represent individual information (e.g. hometown, concentration, class year) while maintaining data privacy and anonymity?
To collect data for the visualization, I designed a survey that I sent out to the entire house. The survey asked about students’ backgrounds (hometown, class year, concentration/secondary) as well as who they had roomed with in Eliot and friends they had made through Eliot.
38 students responded to the survey; among the responses, 665 connections were mentioned. I cleaned and processed the respondent data via a Jupyter notebook. Each student’s field of study (concentration, secondary, or joint) was converted into numerical encoding, and the latitude and longitude values of each student’s hometown were extracted and processed using Lloyd field relaxation to ensure ample spacing between nodes. The data was then imported into OpenProcessing, where the visualization was made.
Visualization

In the visualization, students are represented as colorful circles. The ring colors of each circle encode the respective student’s field of study and class year, and the placement of each circle represents the geographic location of the student’s hometown. Individuals that were mentioned by respondents but did not respond to the survey are represented as small black dots. Connections between students, both roommate relationships and friendships, are drawn as curved lines with varying arc angles.
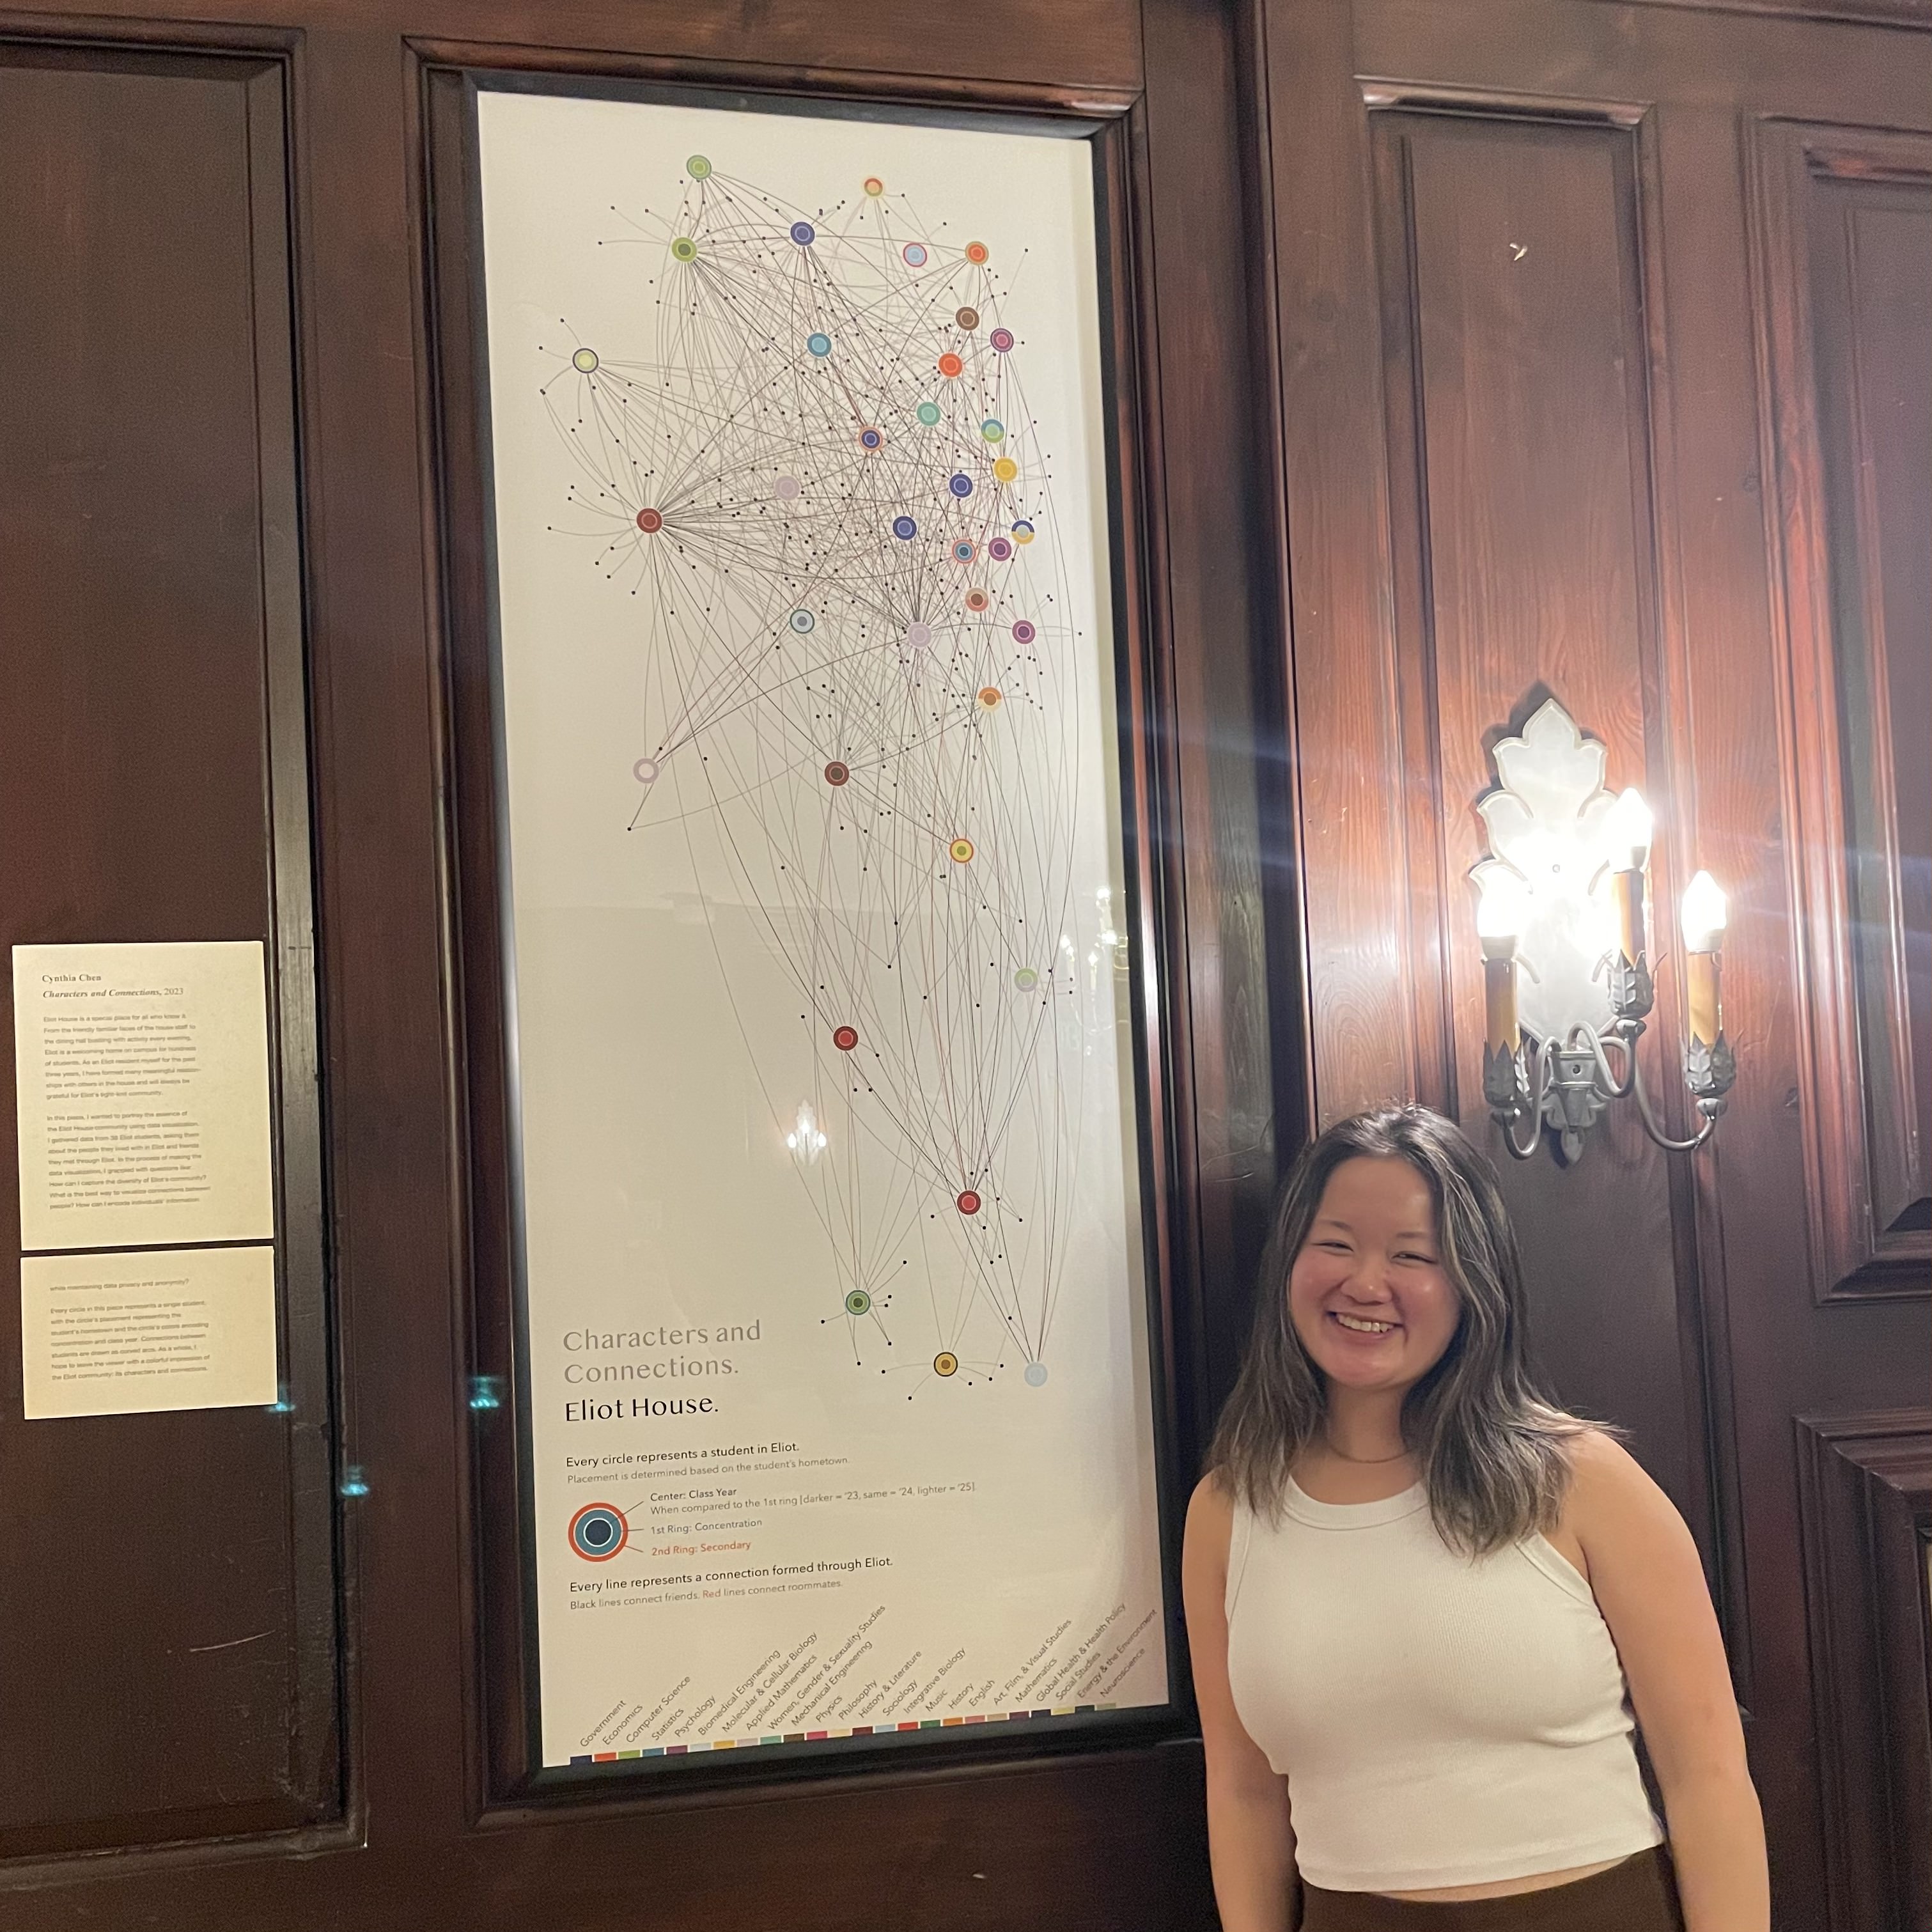
The coolest part of this project was installing it as a permanent art work in the Eliot House Junior Common Room:


This project was supported by the Eliot Community Artist Fellowship, an opportunity for students to create art to be installed in the Eliot Junior Common Room. Many thanks to Stephanie Paulsell, Andi Wright, and Anne Lheem for organizing the fellowship, to Martin Wattenberg for his feedback on initial versions of the piece, and to the 38 participants of the data collection survey.
Questions or thoughts on this project? Reach me via email.