Color
A study on color in paintings @ Harvard Art Museums.

Motivation. As an artist, I have always been fascinated by the use of color. My favorite artistic medium has always been acrylic, due to the vivid and vibrant colors it is able to convey. I wondered, “would it be possible to somehow convey the beautiful diversity of colors found in various artworks?” When approaching this project, I stumbled upon the Harvard Art Museums API, which granted access to a rich dataset of thousands of works in the Harvard Art Museums collection, including hundreds of acrylic paintings.
How was the data visualized? Every circle in the visualization represents one painting. The concentric rings in each circle encode the proportional color composition of the piece. By putting all the painting circles in one frame, one can get a sense of the types of color schemes used in the museum paintings. In the interactive piece, you can hover over a circle to see the piece’s title and artist, and you can also learn even more about an artwork by clicking on a circle to open the artwork’s official page on the Harvard Art Museum website.
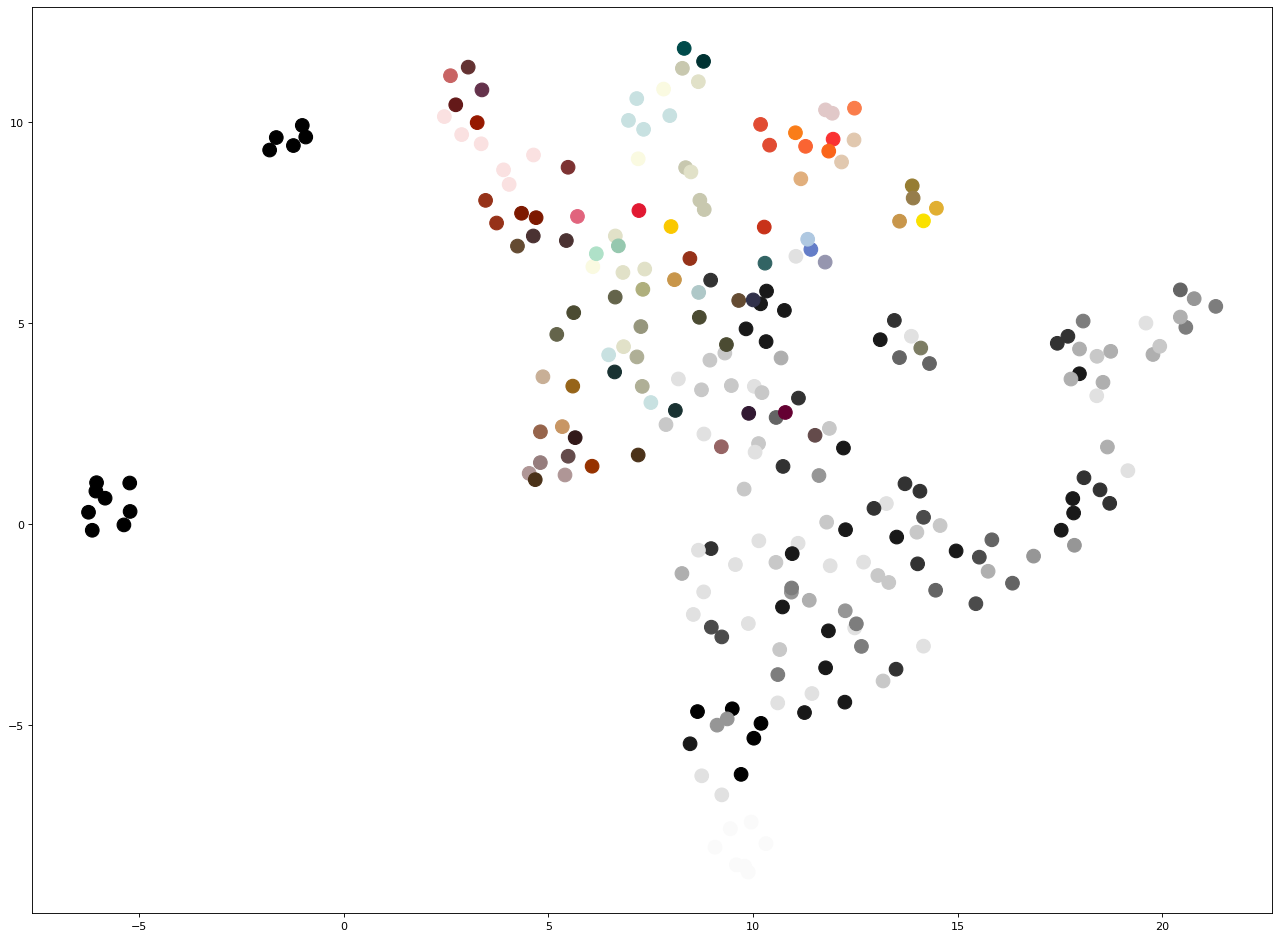
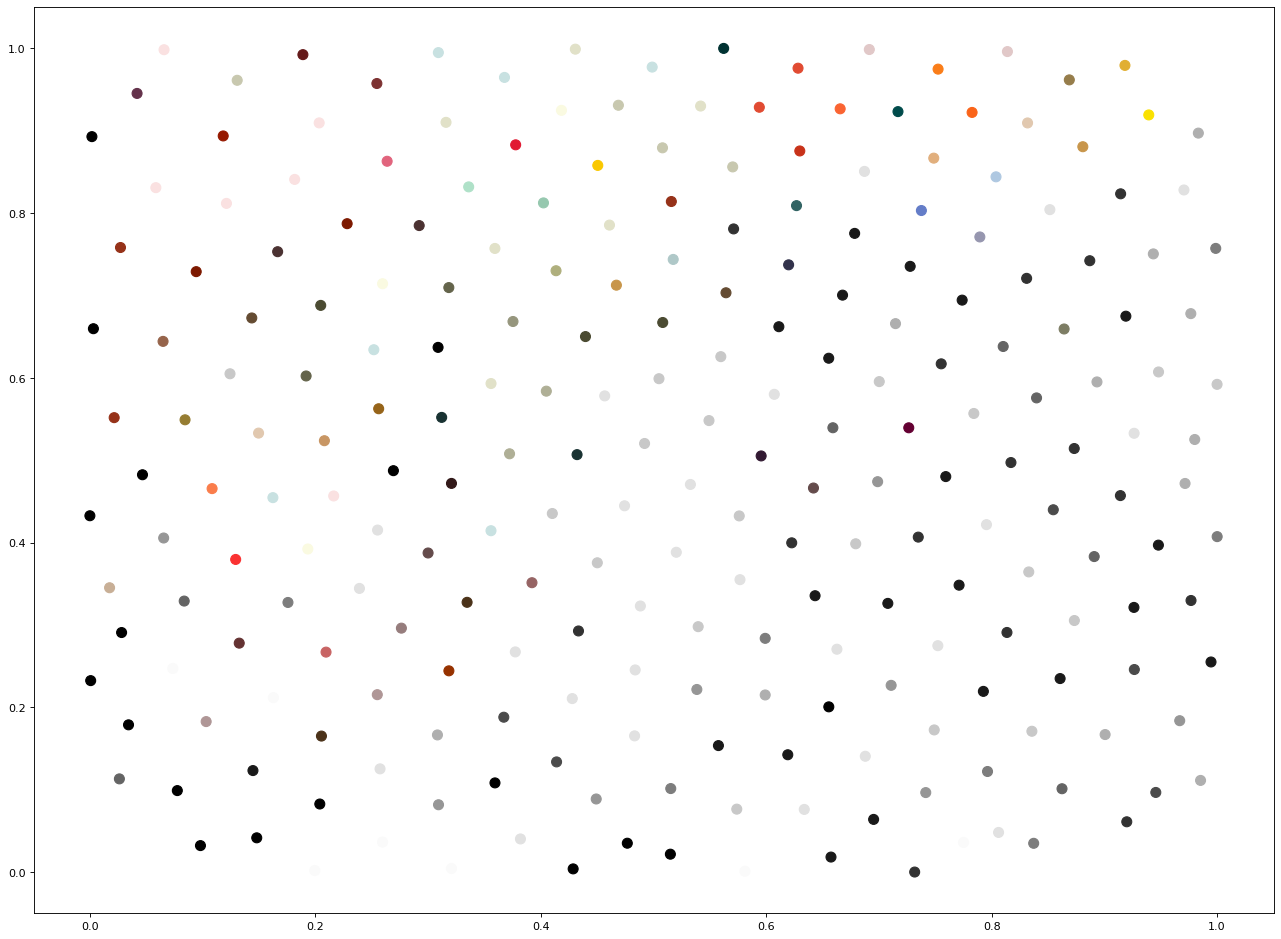
To determine where each painting is placed in the visualization, I employed a data dimension reduction technique called UMAP (Uniform Manifold Approximation and Projection). I first compiled a high-dimensional dataset, where each artwork was tagged with several features, including its medium, year of creation, style of artwork, culture, and colors used. The high-dimensional dataset of artwork features was then projected onto 2D space using UMAP. These 2D coordinates were then relaxed using Lloyd’s algorithm to evenly space the points out, as shown in the figures below. The UMAP coordinates were used to place each artwork in the resulting visualization; thus artworks with similar features are closer together in the visualization.


This piece is best viewed through the interactive version on OpenProcessing. In addition to the interactive version, I also came up with a poster version with small multiples as shown below. Some future directions that I hope to eventually explore include arranging the artworks by time period and noting any color patterns that arise and perhaps adding animations between these two arrangements.

This project was completed as part of the course CS 73: Code, Data, and Art.
Questions or feedback on this project? Email me at cynthiachen@college.harvard.edu.